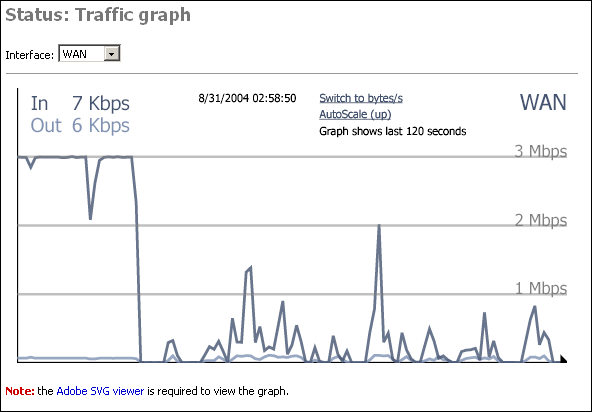
The traffic screen allows you to select an interface, and view real time throughput graphs on that interface. This feature was introduced in version 1.1.
The Adobe SVG viewer is required to view the graphs. This page has a link to the installation for this viewer.
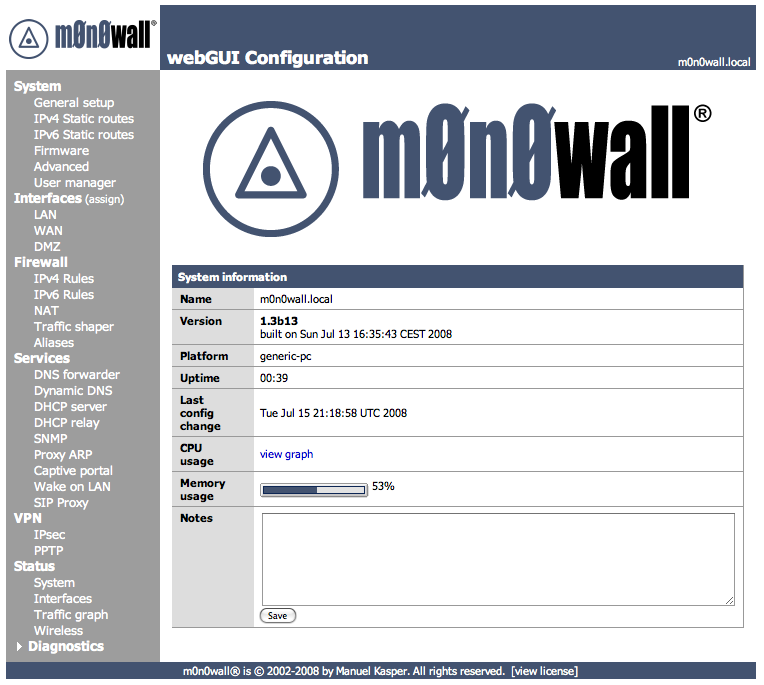
The ultimate page showing the status of your m0n0wall device is actually not shown on the menu. You simply add "/status.php" after the ip address of your m0n0wall device, for example http://10.0.0.1/status.php. This page will show statistics of the following information.
Warning
Make sure to remove any sensitive information (passwords, maybe also IP addresses) before posting information from this page in public places (like mailing lists)! Passwords in config.xml have been automatically removed.
System uptime
Interfaces
Routing tables
Network buffers
Network protocol statistics
Kernel parameters
Kernel modules loaded
ipfw show
ipnat -lv
ipfstat -v
ipfstat -nio
ipfstat -6 -nio
unparsed ipnat rules
unparsed ipfilter rules
unparsed IPv6 ipfilter rules
unparsed ipfw rules
resolv.conf
Processes
dhcpd.conf
ez-ipupdate.cache
rtadvd.conf
df
racoon.conf
SPD
SAD
last 200 system log entries
last 50 filter log entries
ls /conf
ls /var/run
config.xml